Visualizing machine learning optimizers
Machine learning uses mathematical optimization to train neural networks. To provide an intuition of how this works, I developed a web application that visualizes the optimization of a graph layout. The application is implemented in Rust for performance.
The visualization above is interactive. You can view it fullscreen in a separate tab.
Optimization and machine learning
Mathematical optimization is a branch of applied mathematics focused on finding the best solution from a potentially infinite set of choices. In machine learning, optimization techniques such as gradient descent are used to train neural networks. An optimizer makes a network intelligent by finding weights and biases that minimize its error with respect to some training data.
At a high level, the process works by beginning with a random solution and iteratively improving it until it converges on a final design. This description is accurate but unintuitive without a visual aid. The visualization shows this process by beginning with a random set of connected circles and iteratively repositioning them until the connected circles are adjacent. The repositioning of the circles is akin to how weights and biases are updated during training.
Visualization
The visualization begins with a set of randomly positioned circles, some of which are connected. It aims to position the circles such that the distance between connected circles is minimized and none of the circles overlap. To do this, it uses the same optimization techniques used to train neural networks.
You can see the circles gradually converge on the final layout. The controls at the bottom allow you to inspect individual steps. You can select the optimizer in the upper left. You can generate a new graph of a different size in the upper right. Drag and scroll to pan and zoom.
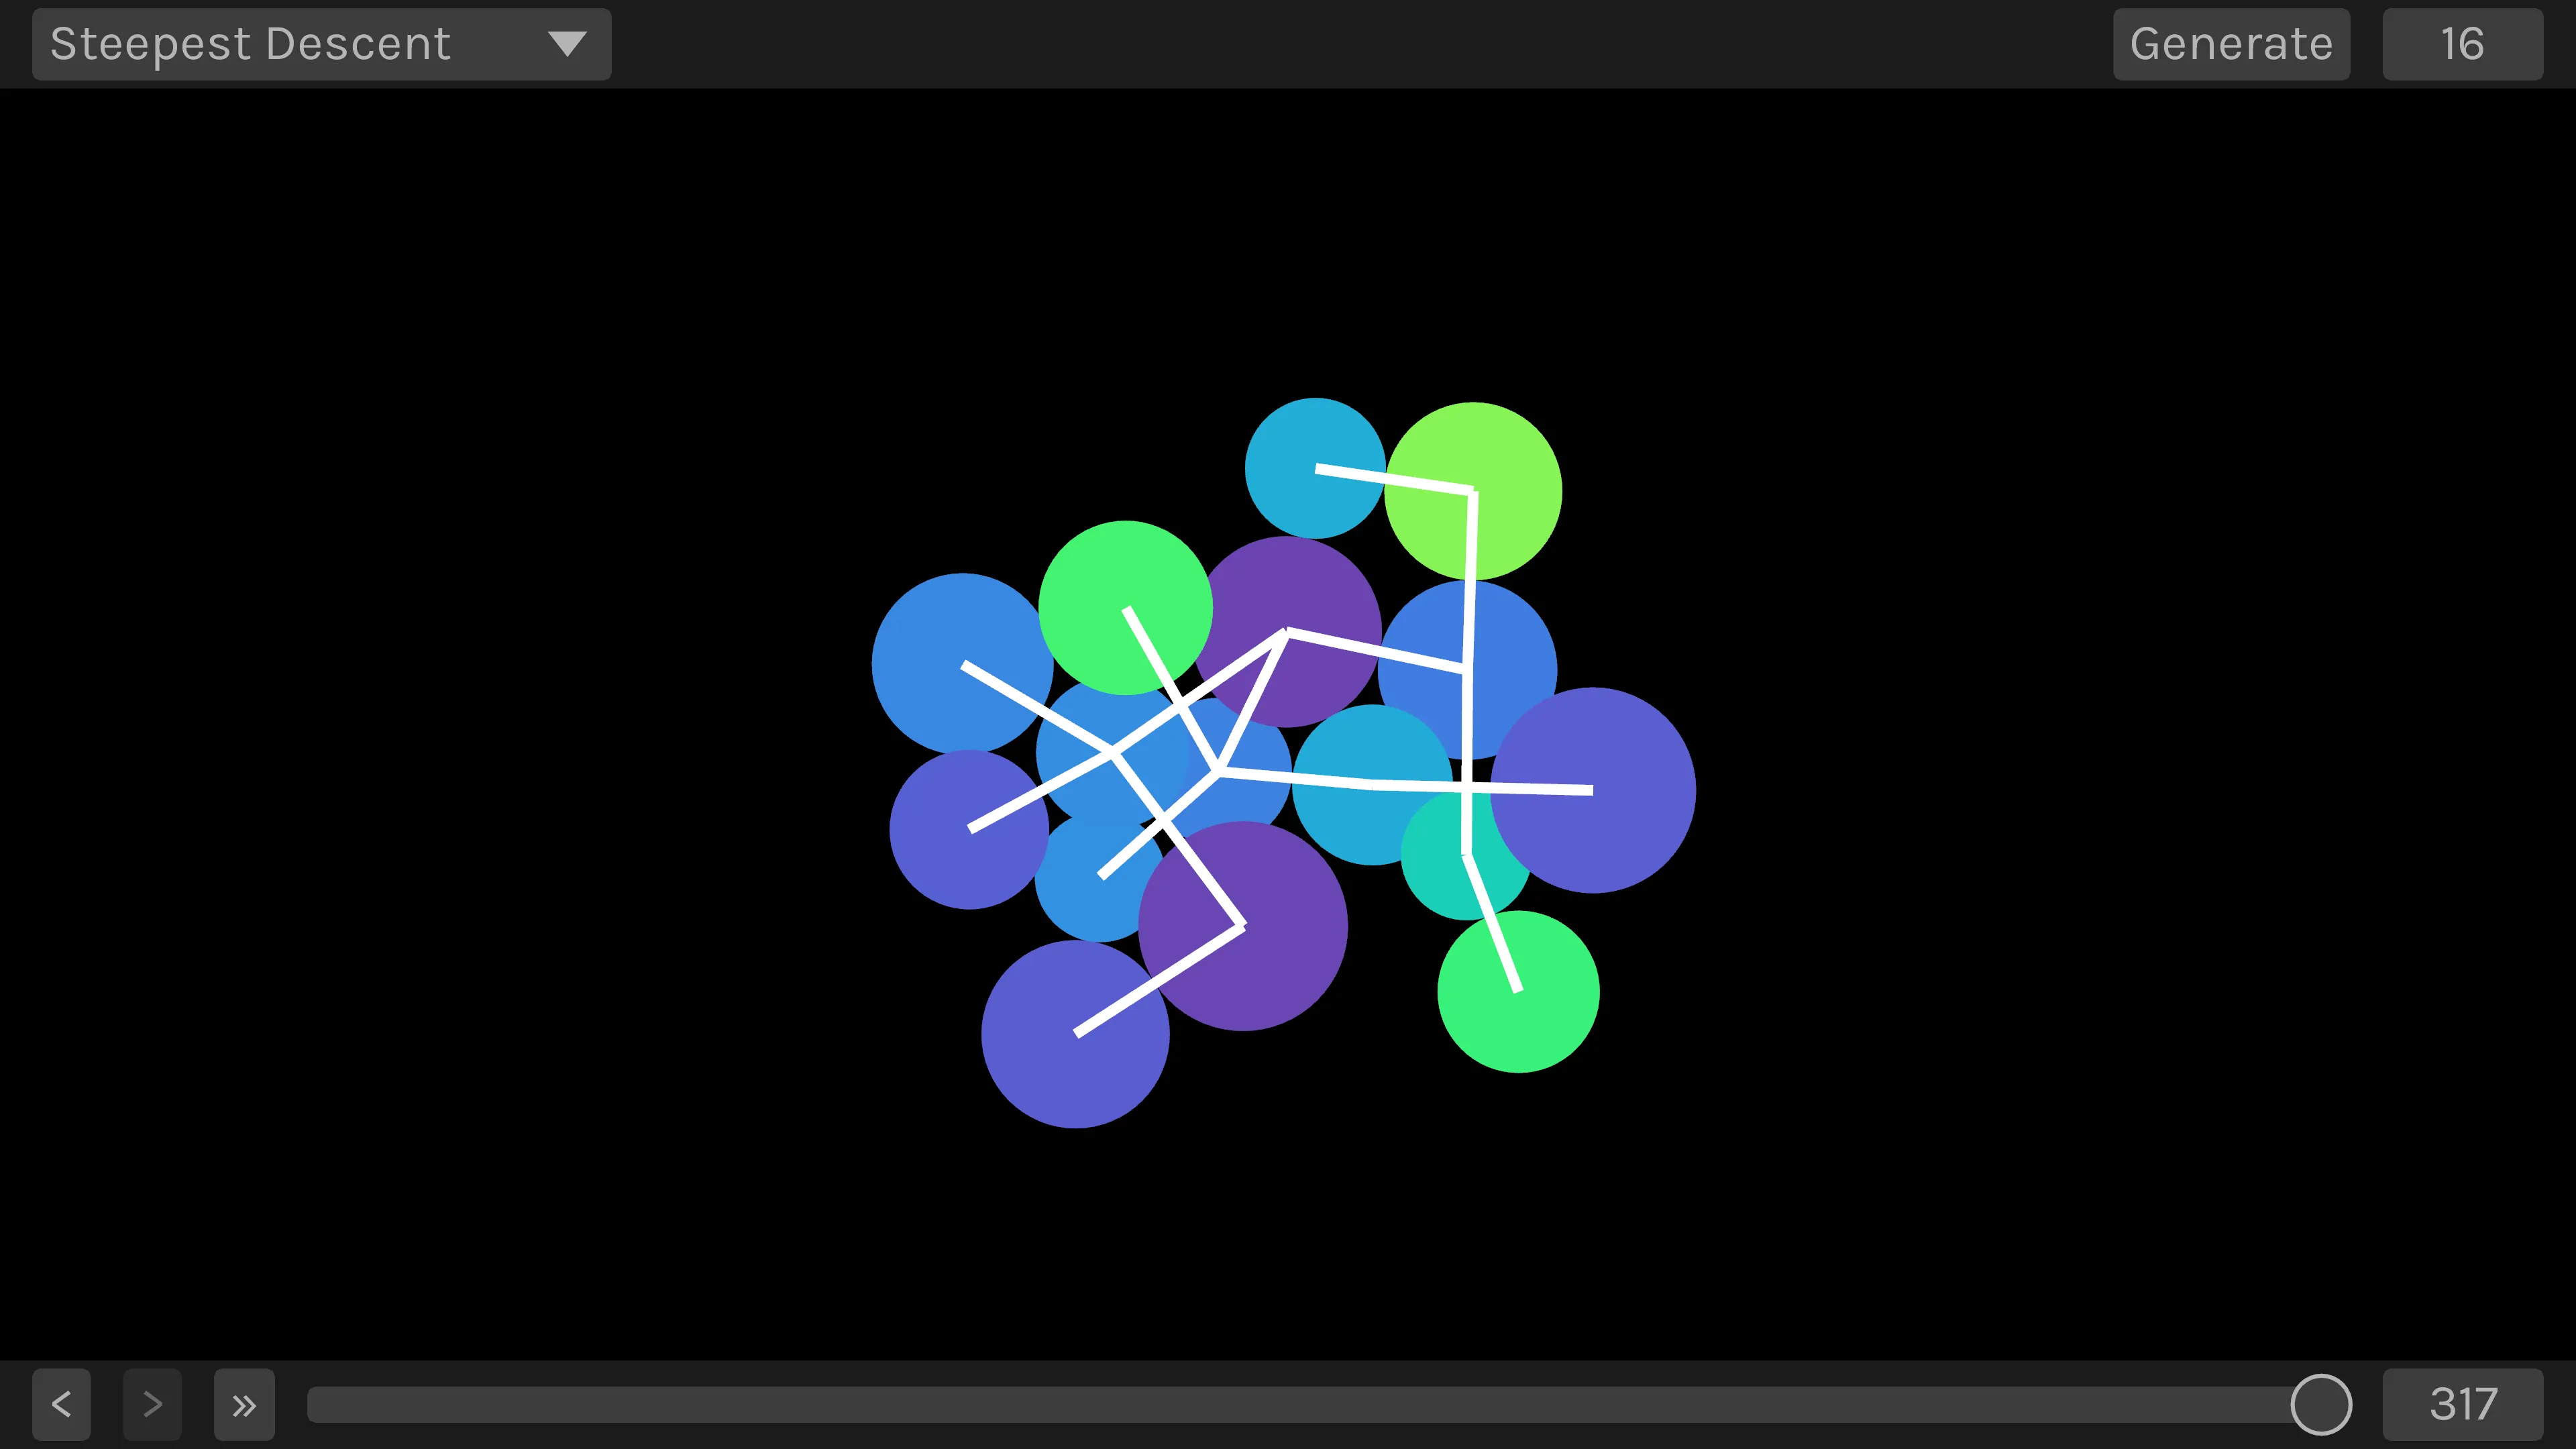
If you generate many random graphs, you will notice the circles sometimes become tangled up. This is known as a local minimum and is a significant problem in machine learning. Momentum methods get stuck less easily.
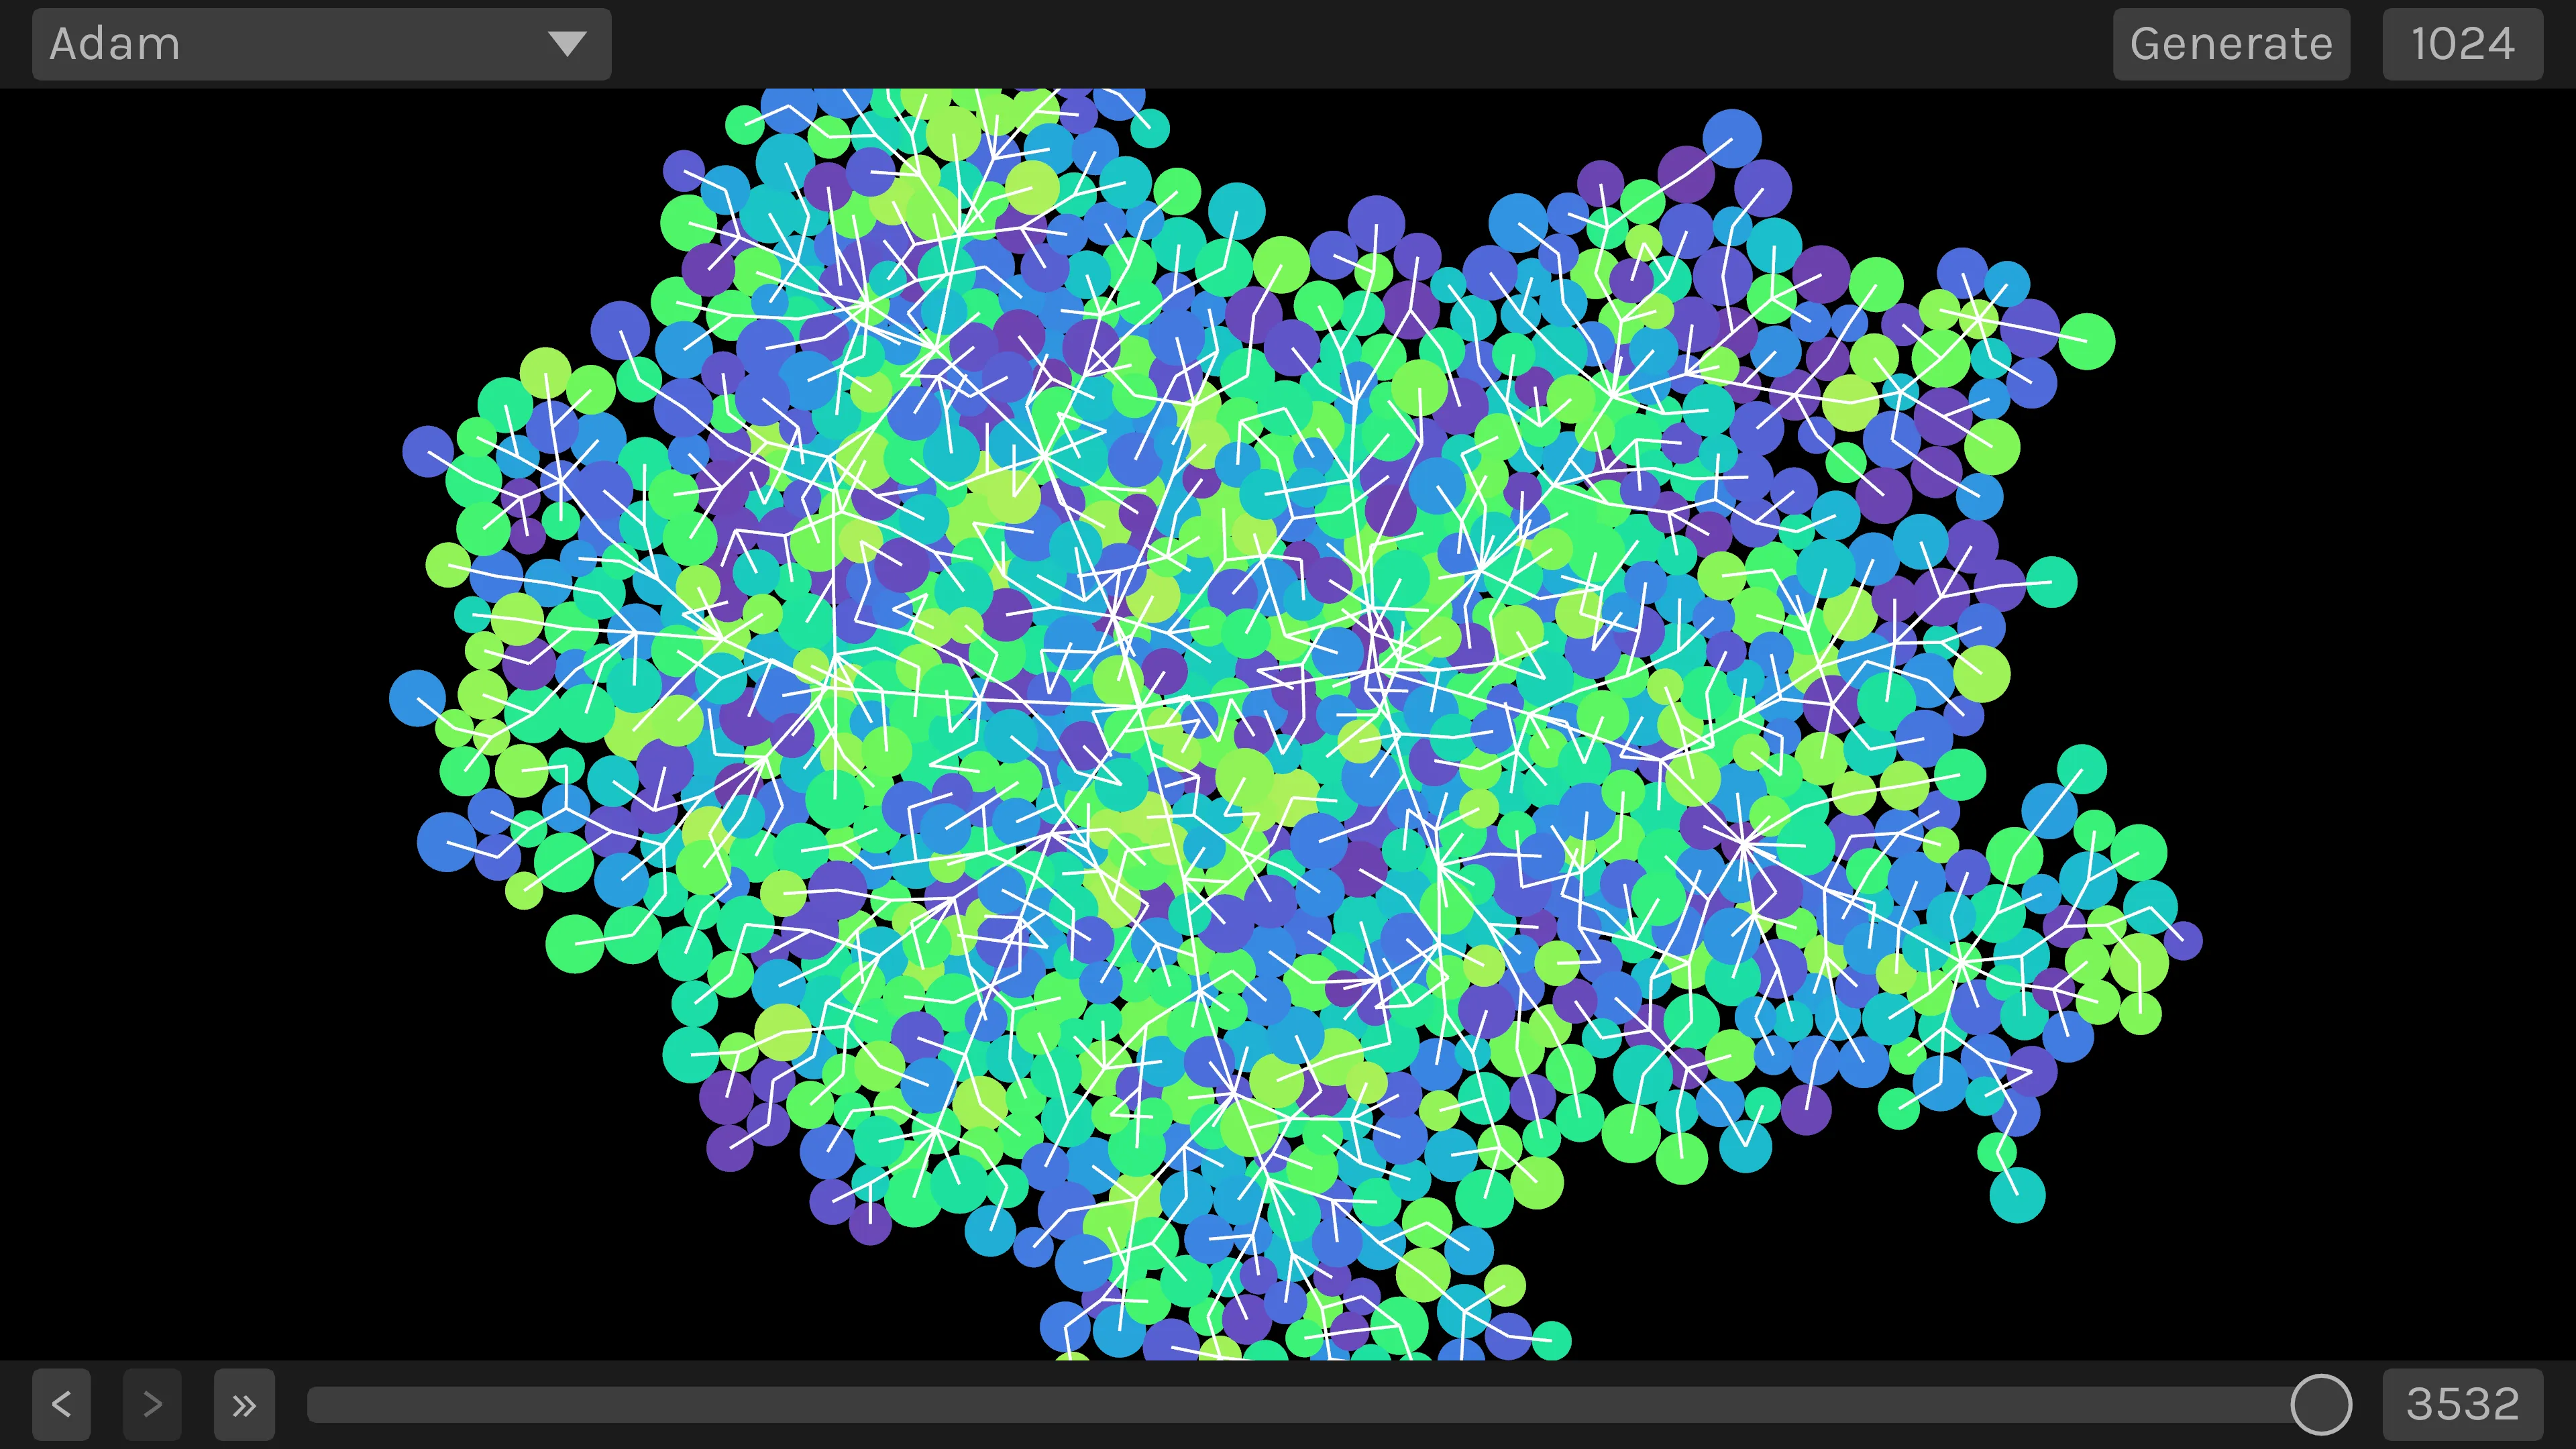
The graphs can be large, but it fails to find a good layout at this size.
Implementation
The application is written in Rust using Bevy and egui for the user interface. It is compiled into WebAssembly and rendered using WebGL 2. It is deployed to Netlify for static hosting. The optimizers are written from scratch in Rust. I paid careful attention to avoid memory allocations for the best performance.
Two extra optimizers are implemented in Julia using IPOPT in JuMP and NLPModels, accessible over a REST API. Those are not public.
The optimizers are based on the presentations in Kochnderfer’s Algorithms for Optimization [1] and Martins’ Engineering Design Optimization [2]. To brush up on my linear algebra and calculus, I read Hefferon’s Linear Algebra [3] and a few books in the CLP Calculus series [4, 5].
Lessons
Rust was an excellent choice because of its performance, precise memory control, and ability to execute on the web. Bevy and egui worked well for the interface but lacked many features compared to a web library like React. Going forward, I am interested in using React for the UI and Rust for the logic.
The application runs entirely in the browser. More complex problems will require more performance. I am interested in implementing the optimizers for GPUs using CUDA or HIP, and visualizing the results on the web with WebGPU.
References
[1] M. J. Kochnderfer and T. A. Wheeler, Algorithms for optimization. Cambridge, Massachusetts Etc.: The Mit Press, 2019.
[2] J. Martins and A. Ning, Engineering Design Optimization. Cambridge University Press, 2021.
[3] J. Hefferon, Linear Algebra. Orthogonal Publishing L3c, 2017.
[4] J. Feldman, A. Rechnitzer, and E. Yeager, CLP-1 Differential Calculus. 2018.
[5] J. Feldman, A. Rechnitzer, and E. Yeager, CLP-3 Multivariable Calculus. 2018.